Are you aware that it costs employers 33% of a worker's annual salary on average to hire a replacement? That is what the research states, along with the fact that 75% of the causes behind employee attrition are preventable. Employee attrition analysis, as stated in one of our previous articles, focuses on identifying these preventable reasons behind employee turnover and the times of the year when you should expect maximum attrition.
Losing a customer-facing employee is especially concerning as clients are more comfortable speaking with people they have an established rapport. Moreover, it hampers your organization's collective knowledge base, and relationships and has a direct effect on revenue. Customer issues and escalations are more likely to increase when you have new folks on the job.
Hence it’s no surprise that employee engagement and employee retention are hot topics in the industry today (especially in a sales organization). The primary focus initially will revolve around preventing employee attrition and identifying methods to improve employee engagement.
There are several qualitative and quantitative metrics for organizations to improve retention. The first step, however, is to build an attrition model that helps you identify the WHO and the WHEN of attrition. Once you have identified these metrics, it becomes easier to focus your attention on key aspects from a retention perspective.
As a part of our conversations, we noticed industry leaders being aware of actionable insights that can be drawn from employee information. However, there was a uniform challenge for everyone in terms of the absence of an out-of-the-box tool. The ones available in the market are custom-made or developed on-demand and need time and monetary investment. These are standalone tools that have separate licensing and integration requirements along with onboarding and learning needs from a usage standpoint. Power BI helps you overcome these challenges and does not need any technical know-how or onboarding. Considering that it comes as a bundled app with Microsoft suite we have put together a free template that will suffice your needs.


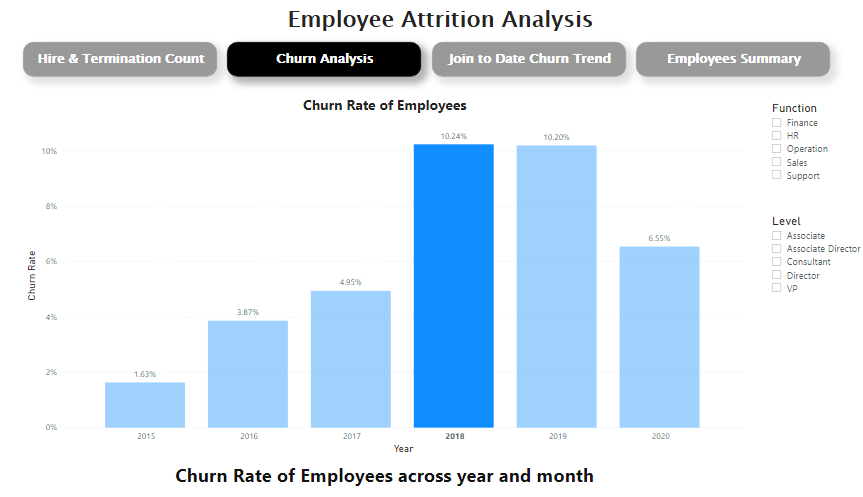
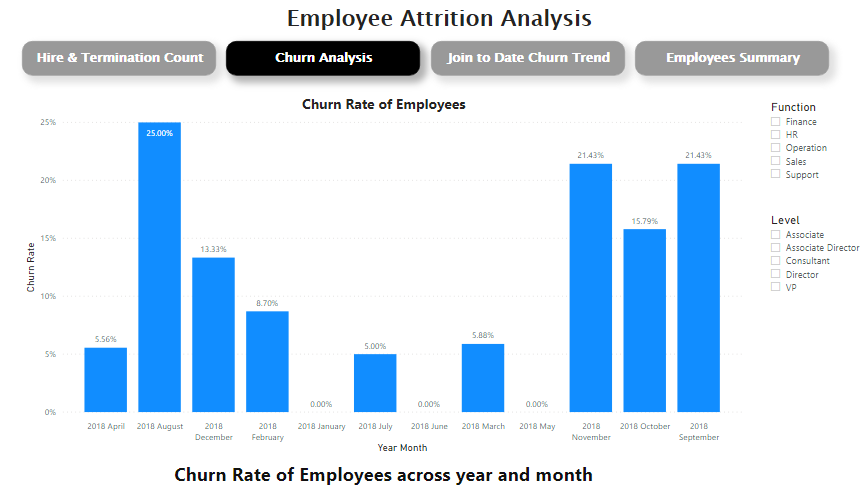
All you need to do is open this template with Power BI and connect it with employee information to see insights, as seen in the first screenshot above. These graphs have been created using the standard attrition rate formula and display attrition rate by year. You can also drill down within a year and find out the attrition rate by month, as seen in the second screenshot above.
Claim your free tool here.
The above tool focuses on the trend of attrition within a year. We will soon follow up with a behavioural analysis of attrition and its reasons. Stay tuned and drop us a note at Incentius if you have any specific needs above and over the free tool we've provided. We would be happy to get on a quick consultation call to address it.


